Microstructure

A new way of measuring microstructure

This whole project is called the Boundary Layer Turbulence experiment, a name which might provoke the question, “How do we actually measure turbulence in the ocean?” Generally, the tried-and-true way is to use tiny sensing elements called piezoelectric beams. These output a voltage when they are deflected, just like the needle on a record player. We deploy them on torpedo-shaped instruments that descend slowly through the water. When the vehicle descends through turbulent water, the beams get deflected by the flow moving back and forth.

(Most of) our 30 hour timeseries in the lower 400 m of the ocean at the location shown in the map. Colors show the quantity epsilon in logarithmic units. Epsilon is a measure of ocean turbulence - it quantifies the dissipation of turbulent kinetic energy. Black contours show temperature.

(Most of) our 30 hour timeseries in the lower 400 m of the ocean at the location shown in the map. Colors show the quantity epsilon in logarithmic units. Epsilon is a measure of ocean turbulence - it quantifies the dissipation of turbulent kinetic energy. Black contours show temperature.

Turbulence in the deep ocean evolves incredibly rapidly.  Here is a figure of turbulence and temperature data we collected over a 30 hour time period. As the tide causes flow up the canyon beneath us (at hour 23:00), you can see the temperature layers (black contours) rising. Colder water from the deeper part of the canyon is moving along the canyon floor into shallower depths and displacing the water above it.  As time goes on, the displaced water reaches a point just like a breaking wave on the beach, where it breaks.  A 200-m wave (20 stories high) is breaking, 2 km beneath the sea!  At that point, very strong turbulence starts (orange/red colors). With the next swoosh of the tide a similar thing happens with temperature surfaces rising and breaking, but this time it looks a little different - we sampled this flow for 2-1/2 tidal cycle and you can see how complex things are!

To resolve the rapidly changing turbulent environment of the bottom boundary layer, we want to sample it as fast as humanly possible. When we profile between the seafloor and 400 m off the bottom every 13 minutes as we have been, we can see the turbulent flows evolving. This allows us to make a pretty picture as shown but more importantly it gives us insight into the structures that arise from turbulence and their effects on the ocean circulation - which is our main goal.  We learned from the dye and our profiling mooring (previous posts) that water is moving up the canyon - and this turbulence is what allows it to happen. We seek to understand the details, and that requires densely sampled, precise measurements.

Our new “epsi-fish” profiler has several new innovations that make such rapid sampling of the deepest layers of the ocean possible.  First, we deploy the instrument from a long boom off the aft quarter of the ship, on a 3000-m slack data cable rolled up on our winch.  By keeping the instrument well away from the ship’s propellers, we can sample while keeping the ship in one place. This may seem trivial, but being able to dynamically position the ship to stay in the same place while profiling is a big deal. Without our long boom, the ship would have to steam away slowly while paying out cable, so the instrument stays safely behind the ship.  This would require more cable, and profiles would take longer because the cable would need to be hauled back in.  Plus, the ship would need to periodically turn to stay in the same place.  Staying in one place saves lots of time and keeps our profiles closely spaced in time.

MOD engineer Sara Goheen recovering Epsifish after a deployment. Here you can see the chute is in its "popped" position. Photo credit: San Nguyen

MOD engineer Sara Goheen recovering Epsifish after a deployment. Here you can see the chute is in its "popped" position. Photo credit: San Nguyen

The second ingredient for fast profiling is a “pop the chute” mechanism.  Most profilers fall slowly all the way down, which is great for measuring turbulence all the way down, but in this experiment we mostly care about the bottom few hundred meters. We don’t want to wait the long time, about 45 minutes, that it would take to slowly go from the surface to the bottom and back.  Instead, we “skydive” down quickly with our drag screens clamped at the instrument’s sides, then deploy them with a command from the surface that triggers a servo actuator, releasing the chute and allowing us then to repeatedly profile the bottom 400 m every 13 minutes.

A third key enabling technology is a precise encoder on our sheave or pulley at the end of the boom which pulls the line steadily off the winch drum.  (The block in itself is a thing of great beauty, which is counterbalanced and has enough degrees of freedom to move with the ship and the seas without chafing the cable.  And for that matter, the completely electric direct-drive winch is another innovation that allows thousands of profiles to be taken at high speed with little service owing to its small number of moving parts relative to a hydraulic or geared winch). By carefully counting turns of the sheave, we know exactly how much line is out and can match that to the measured depth of the profiler.  Knowing how much line we have out is important for two reasons: paying out too much cable can create loops that can get tangled, possibly resulting in knots that if pulled through the sheave can cut the line and lose the instrument.  Second, the instrument detects the seafloor with an altimeter, allowing us to approach within 10 m of the bottom.  However, too much line out can cause the vehicle to hit the seafloor since all the slack must be hauled in before the vehicle begins to rise.

Our final bit of kit, humble as it may sound, is a “crash guard” for protecting the probes in the event of a bottom impact (the author was driving the winch just tonight when said crash guard was put to the test).  In essence a ring slightly proud of the probes, computational fluid dynamics (CFD) modeling was done to ensure that turbulence from the crash guard would not impact the sensitive readings from the shear probes.

Steve Woodward hooking Epsifish to bring it safely back on board. 

Steve Woodward hooking Epsifish to bring it safely back on board. 

All of these pieces together took a huge amount of work by our engineers to develop in the last two years, but have made for a wonderfully successful operation during our long time at sea this summer. We are excited to use these tools in many experiments to come.

Boundary Layer Turbulence - the experiment begins!

To prepare for our exciting Boundary Layer Turbulence Experiment (follow along with the cruise blog) our team has been working around the clock to prepare three different tools for the experiment:

  1. Moorings that, together with instruments from Kurt Polzin at Woods Hole, will measure the turbulence and mixing of cooler water with the warmer water above. These required the usual attention to detail and care in packing and planning each element. Beyond that, we are adding a new element for this experiment: one of our profiling moorings will have an epsi to make turbulence measurements.

  2. We’ll be needing to sample the dye cloud we release near the sea floor as fast as possible. So we have added a fluorometer to our fast CTD. Because the fast CTD rises and falls so fast and samples on both up and down casts, we’ll be able to sample the dye cloud up to 5 times faster than we would by using the standard ship’s CTD rosette.

  3. We’ve made huge changes and improvements to the electronics, software and body of our beloved epsi profiler. Many of the electronics and software changes are invisible, but they greatly increase the reliability and usability of the system. The mechanical changes are more visible and more crucial for the BLT experiment, which only focuses on the bottom few hundred meters of a 2000-m-deep ocean. So we have: i) added a longer, 3000-m cable, to allow us to sample deeper; ii) designed a cool new facility for pressure testing all of our sensors to ensure they don’t have odd effects at depth; iii) completely rebuilt the instrument to be heavier and longer which will make it more sensitive and better at reaching the great depths; and iv) contrary to most microstructure profilers which simply fall slowly the entire way to the bottom like parachuters, epsi now has the ability to “skydive” wherein it keeps its drag screens retracted until receiving a command from above, at which time it “pops the chute” and falls slowly in the lower part of the water column which we care about. With an altimeter, We’ve tested and retested all of these features for months and months in the lab, on the R/V Beyster, and in the 10-m pool at our lab, and think we are ready to go. Indeed, our initial tests yesterday looked great.

Wish us luck - we’re doing new things with new tools and are excited.

The latest and greatest epsi profiler getting assembled in the lab.

The latest and greatest epsi profiler getting assembled in the lab.

Drawing of epsi diving quickly to depth and then popping its chute to take measurements close to the ocean floor.

Drawing of epsi diving quickly to depth and then popping its chute to take measurements close to the ocean floor.

MOD students design and execute a novel kelp turbulence experiment - in a pandemic

A student-designed project to measure the flow around the Point Loma Kelp Forest kicked off this week with the successful deployment of an Acoustic Doppler Current Profiler (ADCP) within the kelp forest. The project was designed by MOD graduate students Bethan, Alex, and Noel, along with fellow graduate student Manuel Gutierrez-Villanueva, for a proposal writing and experiment design class taught by MOD PI Matthew Alford and SIO professor Uwe Send. The project investigates how the presence of vegetation affects coastal flow and the rates of turbulent dissipation outside the kelp forest and within its interior. 

Through the support of UC SHIP Funds and the SIO Scientific Diving Program, operations will continue over the coming weeks with ship surveys aboard the R/V Robert Gordon Sproul to measure ocean velocity, and small-boat operations to collect the first-ever microstructure measurements within a kelp forest using the recently-upgraded epsi-fish, our microstructure profiler. The results of this project will help us understand how physical processes, important for the exchange of nutrients and spores, interact with the Point Loma Kelp Forest, the largest giant kelp bed in Southern California and home to many invertebrates, fishes, and marine mammals.

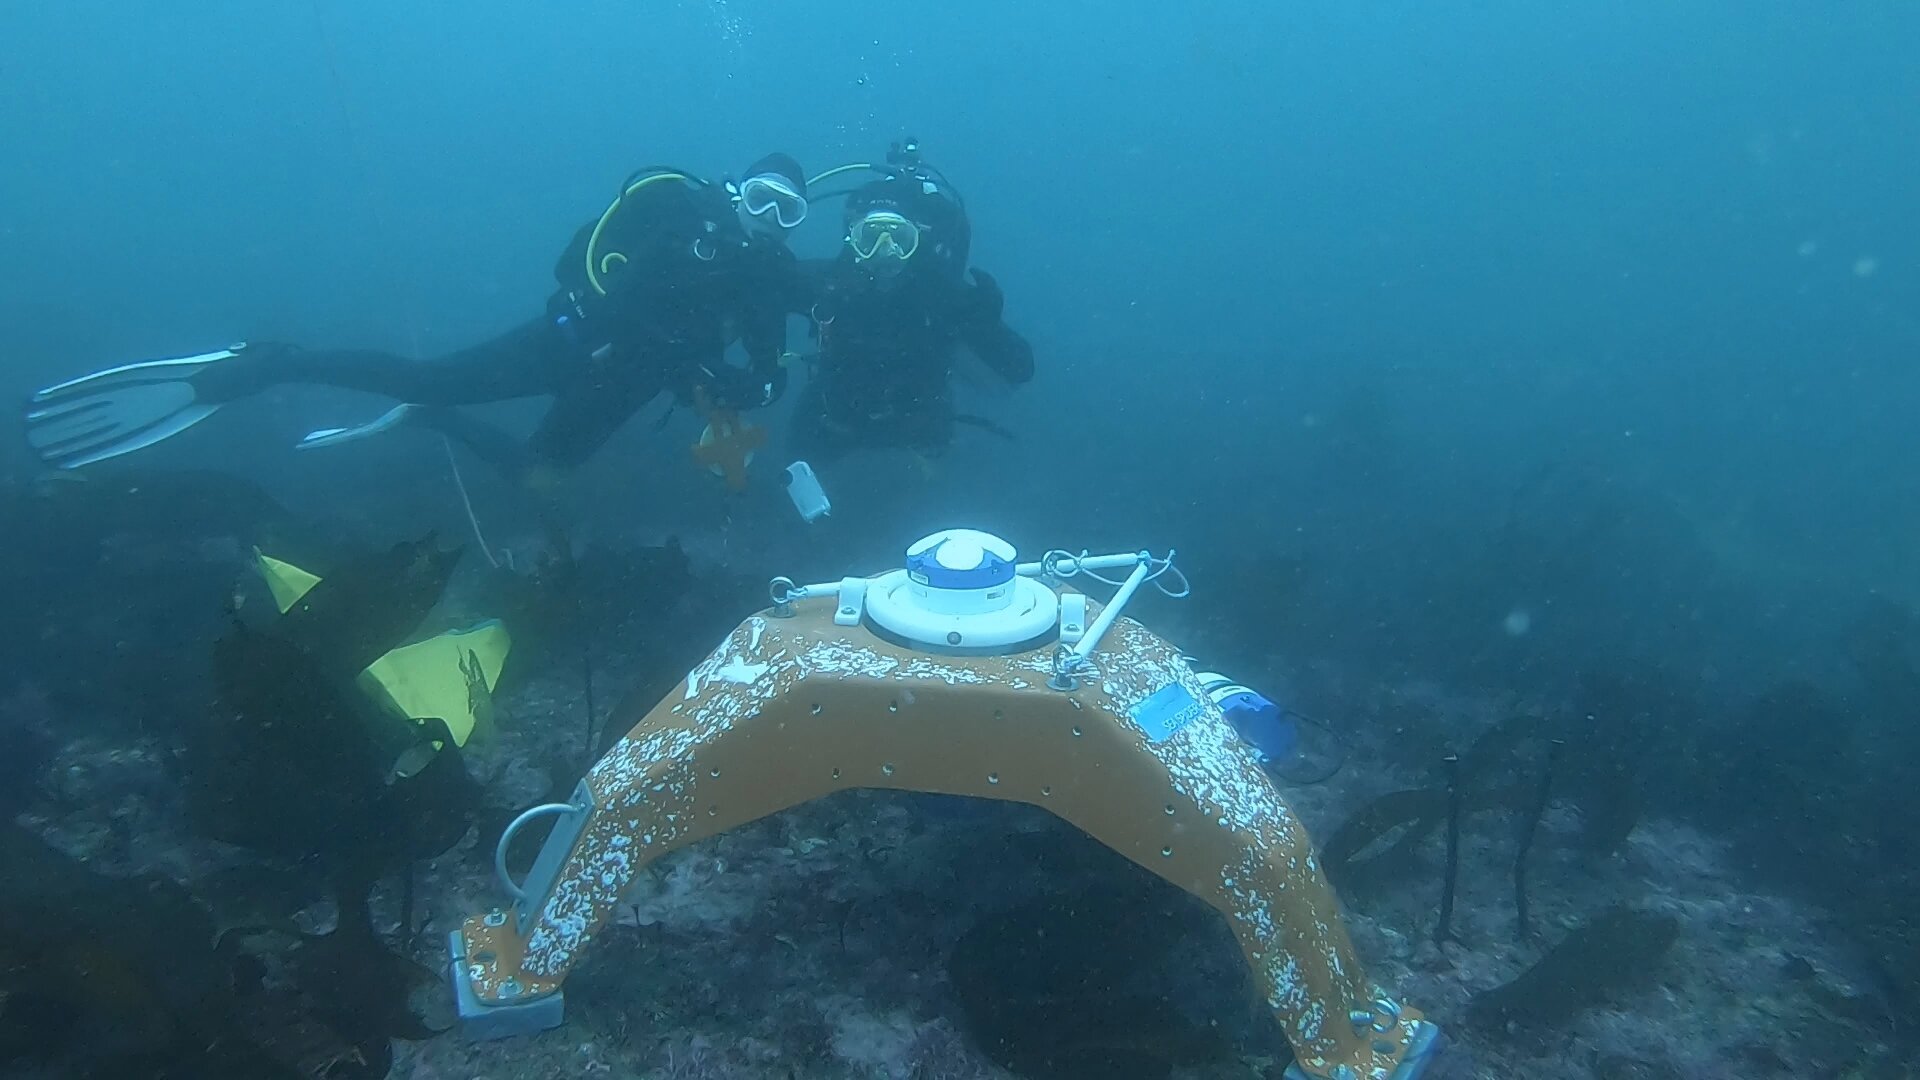
MOD graduate student and scientific diver Alex Andriatis (right) with fellow grad student Anela Akiona (left) after a successful ADCP deployment in the Point Loma Kelp Forest.  Thanks to Jennifer MacKinnon and Amy Waterhouse for loaning the ADCP, an…

MOD graduate student and scientific diver Alex Andriatis (right) with fellow grad student Anela Akiona (left) after a successful ADCP deployment in the Point Loma Kelp Forest. Thanks to Jennifer MacKinnon and Amy Waterhouse for loaning the ADCP, and to Tyler Hughen and Paul Chua for assisting in preparing it.

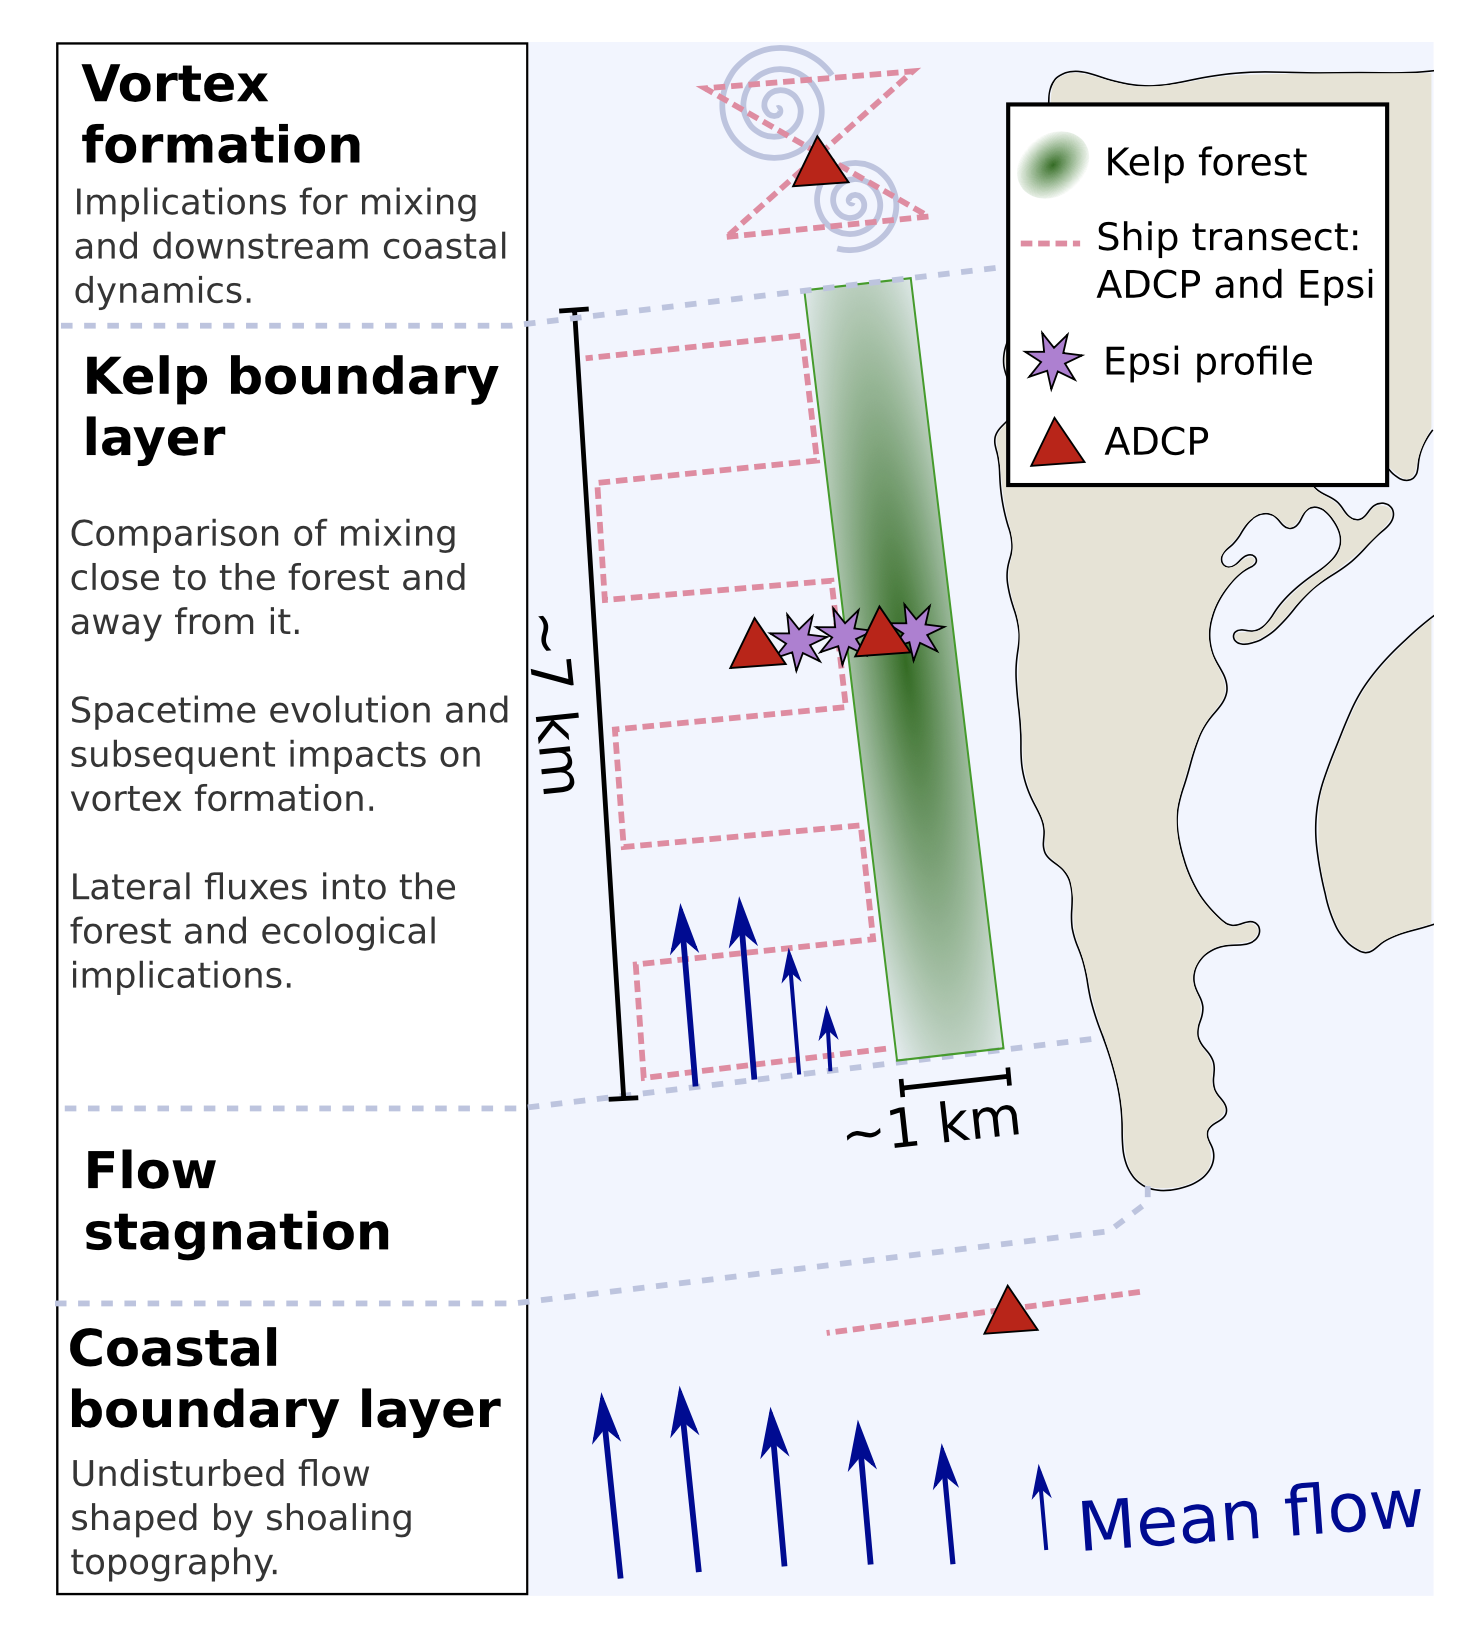
We expect four different physical regimes to exist in the area surrounding the Point Loma kelp forest (detailed in left column). To observe and understand their dynamics, we designed ship transects (pink dotted lines), ADCP deployments (re…

We expect four different physical regimes to exist in the area surrounding the Point Loma kelp forest (detailed in left column). To observe and understand their dynamics, we designed ship transects (pink dotted lines), ADCP deployments (red triangles), and microstructure sampling stations (purple stars) around the forest’s boundaries.

Epsilometer testing

The epsi (short for epsilometer, as it measures the turbulent quantity epsilon) has two shear probes, two thermistors and accelerometers.

The epsi (short for epsilometer, as it measures the turbulent quantity epsilon) has two shear probes, two thermistors and accelerometers.

We are really making progress on the Navy-funded epsilometer!  It is now capable of streaming serial data or writing to compact flash, has a 1000-m pressure case, and can run for a couple of days on AA batteries.  We're beginning to put it on everything, including wire walkers and a newly designed fast CTD vehicle.  


We have a test early November on R/V Sproul and are hoping for excellent results.